Official websites use .gov
A .gov website belongs to an official government organization in the United States.
Secure .gov websites use HTTPS
A lock (
) or https:// means you’ve safely connected to the .gov website. Share sensitive information only on official, secure websites.
CHRNS: CANDOR Autonomous and efficient data collection
Background
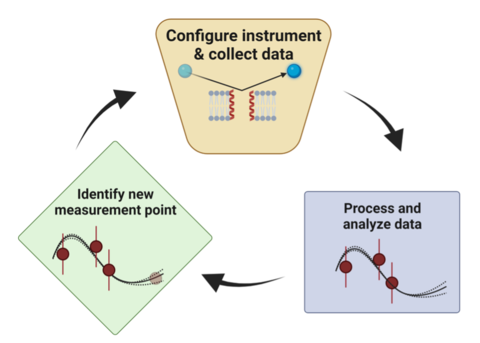
In any experiment, some of the data collected are more useful for answering the scientific question at hand than the rest. If the useful data could be identified in advance, a significant amount of experiment time could be saved; unfortunately, the knowledge required for this identification is not gained until after the experiment is run. Active learning techniques can resolve this contradiction. These techniques operate cyclically, processing and analyzing experimental data and using the analysis in real-time to identify the most valuable data points to be collected next.
Neutron scattering techniques are inherently slow and are thus good candidates for active learning-based autonomous data collection. In addition, many neutron scattering techniques are fundamentally model-based. Examples include diffraction techniques, which measure shaped peaks in reciprocal space; neutron spin echo, which measures a damped sinusoid; or neutron reflectometry, for which data analysis relies on models of thin film structures. In each case, autonomous data collection can identify in real-time the data that will constrain the model parameters of interest in the least amount of measurement time.
Implementation
Using simulated experiments on the CANDOR reflectometer, we determined that 2x - 5x speed-ups are realistic. We successfully devised a framework for efficient reflectometry data collection (manuscript in preparation [1]) and have implemented software to achieve this. Since the framework will collect reflectometry data out-of-order compared to traditional trajectory-based data acquisition, fundamental changes to the instrument control software were required. Those changes are tightly coordinated with the non-equilibrium data acquisition and FAIR data efforts.
NICE improvements
Upgrades to NICE now allow scientists to write custom Python scripting clients that run on other computers (possibly with access to massive computing resources) and can interact with NICE. Multiple such clients can be connected simultaneously, each of which can advertise multiple tasks that users can invoke through the NICE console.

- The NICE queue shows the currently executing script in the queue and what it is doing right now (counting).
- Any connected script can advertise named tasks which can be accessed via the NICE console.
- Auto-complete is fully supported and shows you which scripting clients are connected and what tasks they have available.
- You get a description of the given task (scripting-scientist written) along with any custom argument it takes.
- Custom arguments parsed and presented to your script.
- Implemented a dynamic and multithreaded codebase.
- It counts while simultaneously running a compute thread in the background which is determining the next point to visit.
- This script can connect from any computer, in the building.
- it is running on a local computer in the screenshot so you can see that script has its own GUI (a Python plot).
- Yes, you can build an arbitrarily complex script around the provided API for talking to the NICE server!
- This script also uses our API to ask NICE to advertise all data to the standard NICE data stream.
- You can see everything in the NICE standard plotter and get your NEXUS files written as well!
- Queuing of scripts directly from the NICE console.
- These will each run in order, like other queued commands, even though each individual scripts execution path is non-deterministic.
- This has all been done with safety in mind.
- Hitting "stop" in the NICE client will cause motion to stop and will prevent even the most poorly written script from continuing to execute NICE commands - even though it is running on another machine!
- Note: this also replaces the previous “local” scripting system which allowed you to run scripts in a local folder on the server computer. A compatibility layer has even been put in place meaning most existing local scripts will still work with little to no modification.
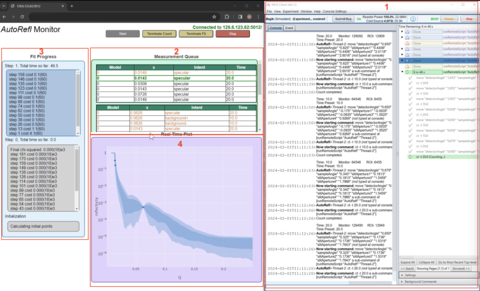
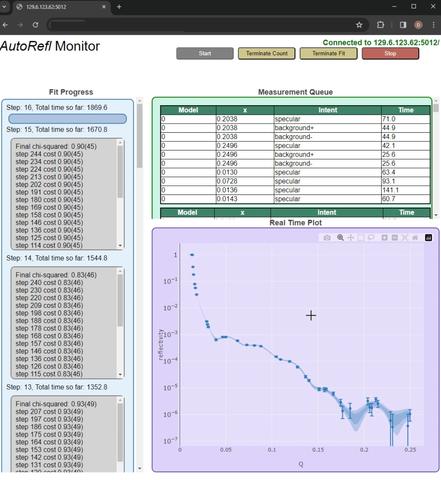
AutoRefl
The data being collected by a neutron reflectometer can be analyzed in real-time, and this information is used to predict which new data points will give the most information going forward. The new data points are then added to set a new measurement queue; once new data is analyzed the queue is again updated.
We have tested the software using the new CHRNS computers, NICE, and a realistic implementation of the reflectometer, MAGIC. Note that we chose this instrument as it is easier to visualize the point-by-point data collection compared to the range of angles covered by the white-beam CANDOR reflectometer - but the process is identical. The software takes into account all needed factors such as background measurements, time to move the detector, deadtime, etc. Here is a screenshot of a simulation in progress.